If you are searching for an AI maker with diagrams, you probably have one core requirement: the diagrams must stay editable. Flat images look fine until you need to change a label, add a step, or localize the content. This post explains how Presentia.ai generates diagram-heavy slides using editable objects, and how Nano Banana Pro improves the visual quality in Preview mode.
What Counts as an "AI Maker with Diagrams"?
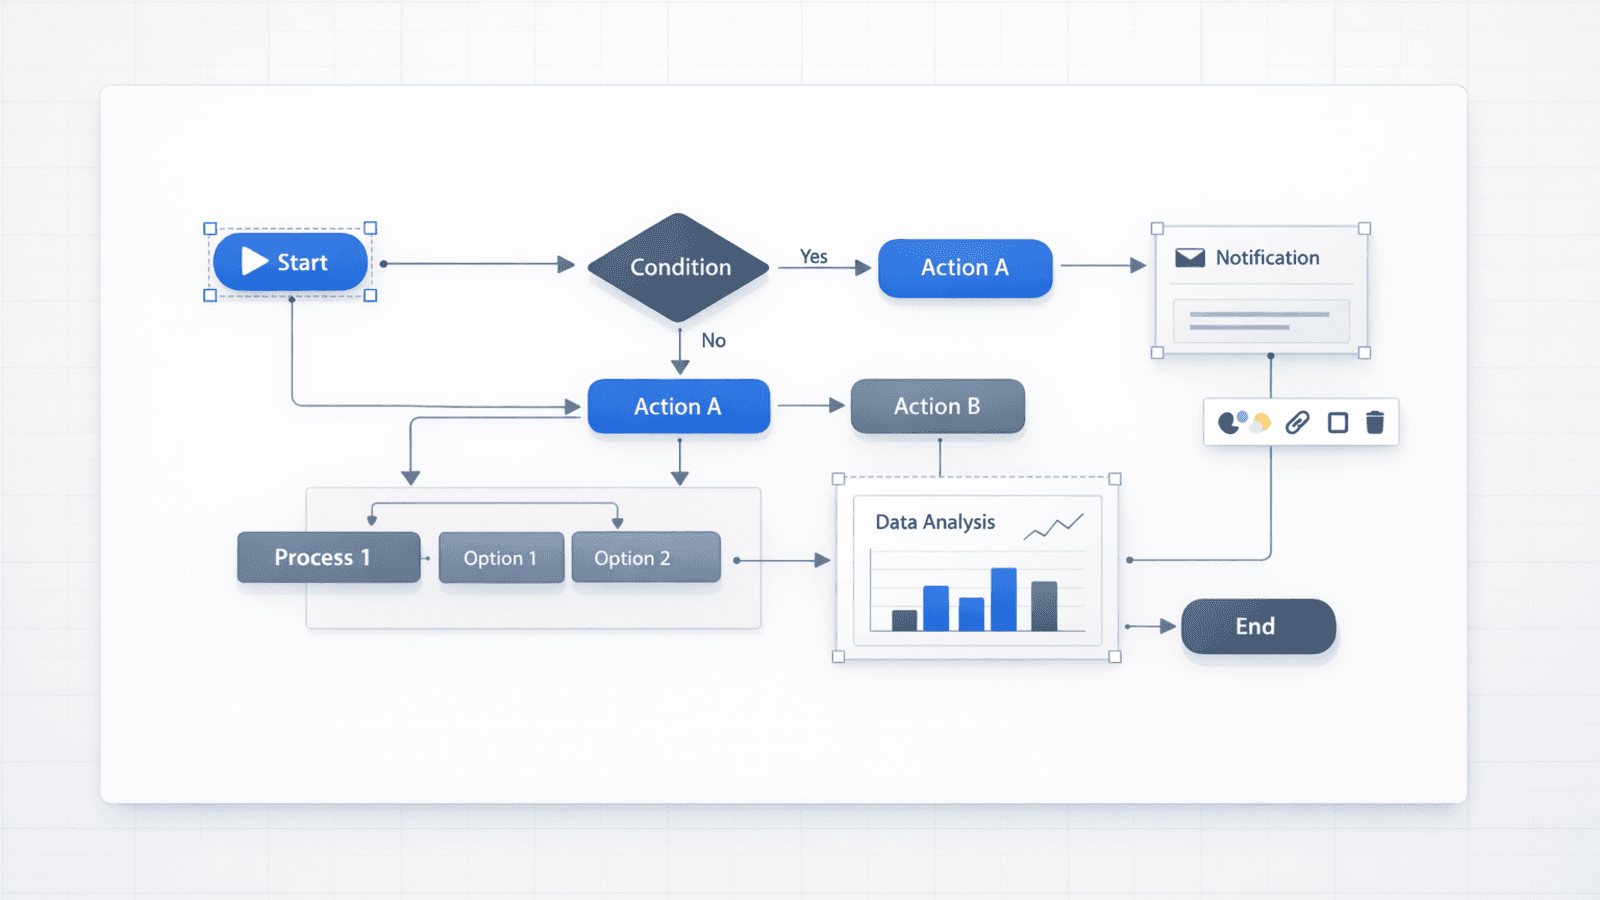
Some tools can generate a diagram as an image. Fewer tools generate a diagram as editable objects. The difference matters when you need to:
Rename steps after stakeholder feedback
Reorder a process flow
Add a new branch or decision point
Apply brand styles (colors, spacing, type scale)
Diagram-heavy slides are easiest to maintain when every label and shape is editable.
How Presentia.ai Generates Editable Diagrams and Infographics
Presentia.ai generates slides as editable canvas elements: text boxes, shapes, images, and tables. That makes it possible to produce process diagrams, frameworks, and simple flow charts that you can still adjust.
The workflow is simple: generate the deck, switch to Edit mode to adjust shapes and labels, then regenerate the Preview render for any slide you changed so the final look stays consistent.
Editable vs flat diagram outputs
Use case
Flat image output
Editable object output (Presentia.ai)
Process flow
Hard to insert steps
Add steps by duplicating shapes and editing labels
2x2 framework
Rebuild to change axes
Edit axis labels and reposition items
Org chart (simple)
Hard to update names
Update text boxes directly
Timeline
Low flexibility
Edit milestones as text + shapes
What Diagrams to Ask For (Fast Wins)
3-5 step process flow (onboarding, implementation, GTM).
Simple architecture or system overview (high level).
Before/After comparison slide.
Prompt Patterns for Diagrams
Diagram prompt template
Create a presentation and include a diagram slide.

Diagram type: [process flow | 2x2 | timeline | framework]
Slide title: [TITLE]
Labels (must be editable):
- [LABEL 1]
- [LABEL 2]
- [LABEL 3]
- [LABEL 4] (optional)

Constraints:
- Keep the diagram as shapes + text boxes (no screenshot-style images)
- Use large readable labels
- High contrast
Step-by-Step: Edit a Diagram After Generation
Generate the deck and locate the diagram slide.
Switch to Edit mode and click each label: rewrite for clarity and consistency.
Adjust spacing and alignment (diagrams look professional when they are evenly spaced).
If you add/remove a step: duplicate shapes, update connectors, and keep labels large.
Regenerate the Preview render for that slide so the high-fidelity look stays in sync.
This is the main advantage over flat diagram exports: you are not stuck regenerating the entire slide just to change one label.
Example Diagram Requests (You Can Reuse)
Example: 4-step onboarding flow
Step 1: Connect data
Step 2: Configure workspace
Step 3: Create first deck
Step 4: Export + share
Example: 2x2 prioritization framework
Axes: Impact (low → high) and Effort (low → high)
Quadrants: Quick wins, Big bets, Fill-ins, Avoid
The more specific your labels are, the easier it is for the generator to produce a diagram you can present without rewriting everything.
Nano Banana Pro: Better Visual Quality Without Losing Structure
Nano Banana Pro generates a high-fidelity AI preview render for each slide (Preview mode) so the deck looks premium fast. Your editable objects remain available in Edit mode, so you can keep diagrams maintainable.
Diagram Quality Checklist
Can a viewer read every label from a laptop screen?
Is there one main message on the slide?
Are there 3-5 steps, not 10+?
Does the diagram have enough whitespace and alignment?
After edits: did you regenerate the Preview render for the changed slide?
Common Diagram Mistakes
Too many nodes: simplify to the few steps that matter.
Tiny labels: increase font size and reduce wording.
No hierarchy: use one headline and clear groupings.
Inconsistent naming: keep labels parallel (verbs or nouns, not both).